Friday, December 9, 2016
Gold Warning: Danger Ahead!
Friday, November 18, 2016
USDollar Index New High

USDollar Index Monthly Chart
A historic moment! After 20 consecutive months of range-bound price action and 2 or 3 fakedowns, the USDollar Index (ticker: USDX, DXY) finally broke out the frame pattern and is headed for new highs. What does this mean for gold? Nothing positive I think. Gold is trending down and unless the USDX starts to correct below the breakout level of 100.78, I see no stop for gold's plunge. I am observing a very different trading environment post-elections and I like it - a trending trading environment, which is probably the best, that a trader could ask for; the trends are well-defined, there are no mean reversions and once you identify an intraday trend, it's easy to jump on it and hold your positions for a nice profit, just wait for a pullback to enter. Don't bet against the trends, this is not a winning strategy in the current environment. Also, don't be one of these guys, that wait for confirmation forever, because they're afraid to enter a position, as they're betting too big a position and this drains their mental capital, end up buying the top of the intraday trend and sell the low. I've done this, it's not something you should do as a daytrader. As a daytrader you should be brave and jump into the deep with the head towards without knowing how deep it is, but you have to be prepared to get out very fast, should the market turns against you; you can't afford to hold a position that goes against you more points, than your potential profit would be.Good luck all and happy weekend,
Petko Bankoff
Thursday, November 17, 2016
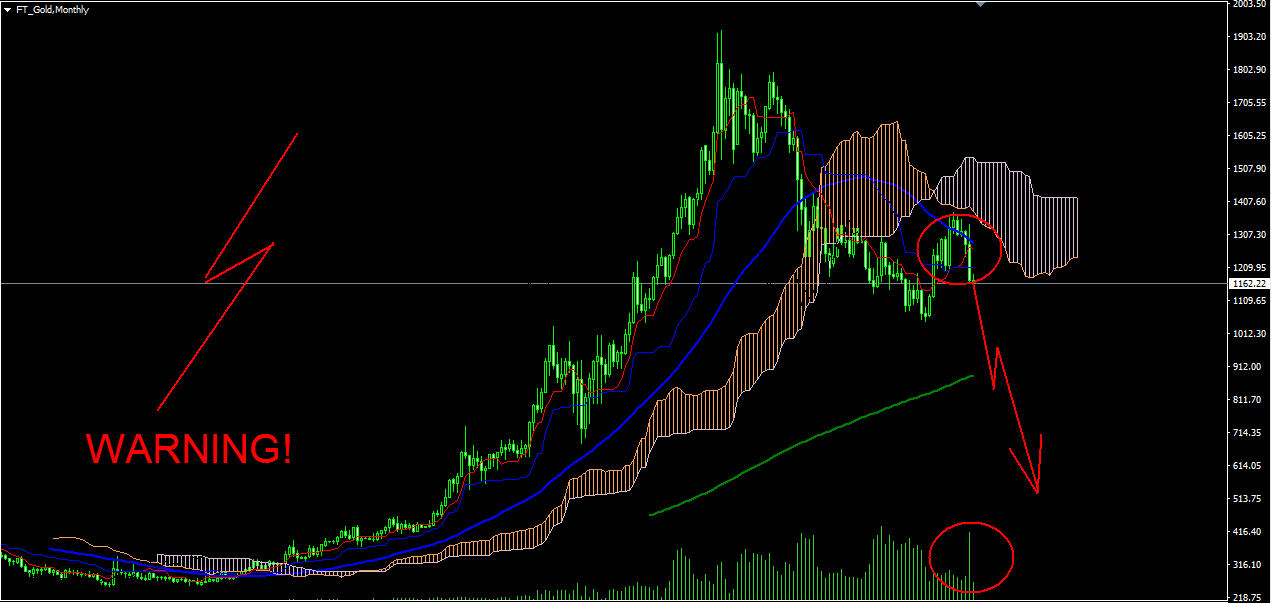
Gold: A New Bear Market Is Born

Gold Futures Monthly Chart (MN)
A common concept of all the delusional foolish gold bugs is that gold is a long term bull market. Well, this ain't true at all. All I can see is an inflated bubble that burst. The monthly chart that I presented to you above covers the last 10 years of data. You can clearly see that gold broke below the orange Kumo Cloud, and after an upside correction, it was unable to break above the cloud again and is currently forming a new bear market Kumo (the blue cloud), which is indicative of a newly forming bear trend. So for the gold bugs - I don't know what do you mean by "long term investing", but in the next 10-20-30 years I see only downside for gold, though with some occasional upside corrections, of course. Unlike you, I can't wait a lifetime to see if my trade works or not, life's too short to waste it in retarded philosophies, invented by a bunch of gold brokers-gurus, who are trying to sell you butterflies and fairy tales.
I see the next stop in gold around the 200MA, which is around $900/ounce. I do believe it will be broken and gold will continue down towards $600 (and why not $400), though there will be some fight there and it won't come easy.
Now to zoom a bit further, let's take a look at the weekly chart. The beauty of technical analysis is that you can actually support your thesis with facts, not imaginary "currency wars" and "end-of-the-world" fairy tales about unicorns.

Gold Weekly Chart (W1)
Gold looks like a failed rally from the lows around 1030s; the last few candles are big red candles, which means only one: the rally (if we can call it that way) is over! To be more specific: that's a correction in a bear market, I can hardly call 300pts move over a whole year period, a "rally". I'm sorry, gold bugs, but I see absolutely nothing positive in gold's price action, you're being fooled badly by a bunch of retarded gold brokers, who make loads of money from your commissions and your stupidity. All those gold brokers, who try their best to convince you that gold is actually in a bull market (here follows laughter from the public), remind me of those bankers pre-07, who were selling rubbish subprime MBS, knowing that they're selling junk, but were still doing it, because they got greedy to get more and more commissions, regardless of the fatal consequences for the whole world, not just for their clients.
On a positive note, a weekly candle close above 1340 would open the door for more upside correction towards 1500s, though I see it as highly unlikely, given the recent price action development.
Good luck to all, bugs or schmugs, stay smart.
Petko Bankoff
Thursday, November 10, 2016
Gold Not So Precious

Gold futures market H4 time frame (ticker: GC_F)
Wednesday, November 9, 2016
A Historic 120pts Drop of the US Stock Market S&P500 Futures

SPX - USD Correlation

Tuesday, November 8, 2016
USDollar Index and S&P500 Correlation
For second day in a raw, at least that's my impression, the USDollar Index and the S&P500 show positive correlation close to 0.8-0.9.
 What does this mean, I guess we'll find out pretty soon. One is faking for sure, but which one?

Subscribe to:
Posts (Atom)