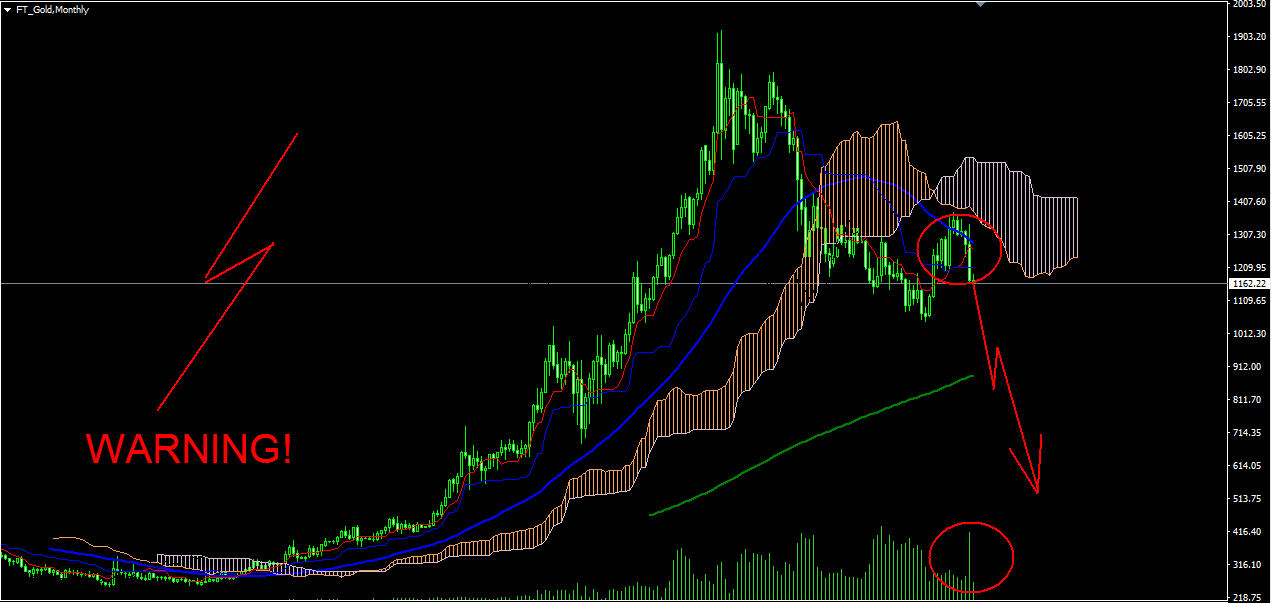
Let the above chart speak for itself. The bubble has started to deflate after the more than one year upside correction. The 2 systems that I used in this chart - Ichimoku (which is a trend following system) and the 50MA (the thick blue line) signal only one thing - TIMBER! Watch out, bulls!
Thank you for your help
ReplyDeleteJoker123
slot online
bandar joker123
daftar joker123
agen joker338